Difference: SNeSimulations (1 vs. 14)
Revision 142017-02-17 - RahmanAmanullah
Revision 132017-02-17 - UlrichFeindt
| Line: 1 to 1 | ||||||||
|---|---|---|---|---|---|---|---|---|
Simulation of SNe Observation for Survey Strategy Observations | ||||||||
| Line: 20 to 20 | ||||||||
The SN Ia i-band requirements originate from: 1) lightcurves in at least three filters are necessary for SN Ia distances; 2) SN Ia physics science based on measuring the characteristics of the second peak (time and peak flux) visible at filters redder than the R-band; 3) Detection of the second peak is a unique feature of SNe Ia, and can be used to photometrically type the full sample after the survey complete, which is necessary for detailed and unbiased SN rates studies above the spectroscopic threshold of z=0.1.
SN Ia cosmology | ||||||||
| Changed: | ||||||||
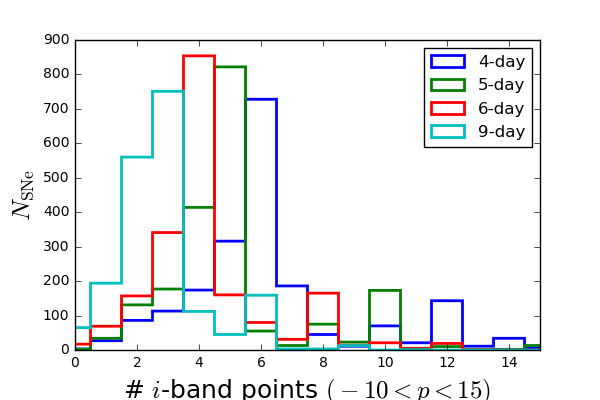
| < < | The primary goal of the ZTF SN Ia survey is to provide a low-z legacy sample for future cosmology analyses. To reach this goal, we require lightcurves of 2000 SNe Ia in at least three bands, as described in the white paper, where the lightcurve of each SN in the sample needs to be measured with a statistical precision that is at the level or better than the intrinsic uncertainty of SNe Ia. For ZTF the limitiation will be the effective cadence of the I-band survey. To estimate the properties of the I-band peak we need at least four data points within -10 < p < +15 days with respect to time of maximum, with at least one point before and one point after maximum. Based on simulation we conclude that this criteria will be reached for xx-XX, yy-YY, zz-ZZ of the discovered SN Ia sample at z<0.1 for a 4,5,6 and 9 day cadence respectively. The range corresponds to the expected uncertainty due to the weather conditions. The simulations have been carried out assuming weather conditions for 2013 and 2016. The full histogram is shown below. | |||||||
| > > | The primary goal of the ZTF SN Ia survey is to provide a low-z legacy sample for future cosmology analyses. To reach this goal, we require lightcurves of 2000 SNe Ia in at least three bands, as described in the white paper, where the lightcurve of each SN in the sample needs to be measured with a statistical precision that is at the level or better than the intrinsic uncertainty of SNe Ia. For ZTF the limitiation will be the effective cadence of the I-band survey. To estimate the properties of the I-band peak we need at least four data points within -10 < p < +15 days with respect to time of maximum, with at least one point before and one point after maximum. Based on simulation we conclude that this criteria will be reached for 77-88%, 62-82%, 42-70% or 13-18% of the discovered SN Ia sample at z<0.1 for a 4,5,6 and 9 day cadence respectively. The range corresponds to the expected uncertainty due to the weather conditions. The simulations have been carried out assuming weather conditions for 2013 and 2016. The full histogram is shown below. | |||||||
SN Ia physics with the I-band | ||||||||
| Changed: | ||||||||
| < < | The time and characteristic of the second peak is both correlated with the Ni mass of the SN Ia, and provides a promising path for improving standardization of SNe Ia for cosmology. In order to obtain an unbiased measurement of the second peak, it is not enough to sample only the peak itself but also to capture the minimum between the two peaks. In order to do this we require at least 6 datapoints between 10 < p < 50 which will be reached for xx-XX, yy-YY, zz-ZZ of the discovered SN Ia sample at z<0.1 for a 4,5,6 and 9 day cadence respectively. | |||||||
| > > | The time and characteristic of the second peak is both correlated with the Ni mass of the SN Ia, and provides a promising path for improving standardization of SNe Ia for cosmology. In order to obtain an unbiased measurement of the second peak, it is not enough to sample only the peak itself but also to capture the minimum between the two peaks. In order to do this we require at least 6 datapoints between 10 < p < 50 which will be reached for 68-82%, 44-66%, 26-48% or 11-15% of the discovered SN Ia sample at z<0.1 for a 4,5,6 and 9 day cadence respectively. | |||||||
 | ||||||||
Revision 122017-02-17 - RahmanAmanullah
| Line: 1 to 1 | ||||||||
|---|---|---|---|---|---|---|---|---|
Simulation of SNe Observation for Survey Strategy Observations | ||||||||
| Deleted: | ||||||||
| < < | I-band requirementsThe SN Ia i-band requirements originate from: 1) lightcurves in at least three filters are necessary for SN Ia distances; 2) SN Ia physics science based on measuring the characteristics of the second peak (time and peak flux) visible at filters redder than the R-band; 3) Detection of the second peak is a unique feature of SNe Ia, and can be used to photometrically type the full sample after the survey complete, which is necessary for detailed and unbiased SN rates studies above the spectroscopic threshold of z=0.1.Target statistical uncertaintyThe primary goal of the ZTF SN Ia survey is to provide a low-z legacy sample for future cosmology analyses. To reach this goal, each SN in the sample needs to be measured with a statistical precision that is at the level or better than the intrinsic uncertainty of SNe Ia. For the full population of normal SNe Ia the r-i color uncertainty is close 0.08 mag (e.g. Burns et al, 2014). In order to decrease the uncertainty on individual SN Ia distances beyond today's level, by subdividing dividing the sample, the individual colors will have to be measured with higher precision. It has been shown that when SNe Ia are subdivided based on spectroscopic similarities V-I uncertainties down to 0.03 magnitudes can be obtained. | |||||||
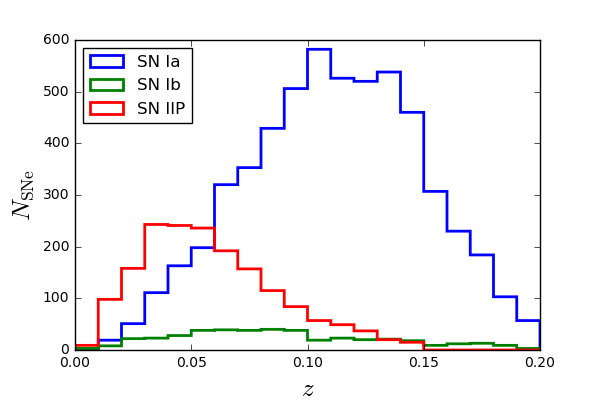
Discovery ratesWe have based all our discovery rates using the assumption that 15000 square degrees will be covered over a 3-day period in the g and r bands (the MSIP survey), using a fixed schedule. A discovery is defined as two points detected on the rise with S/N > 5, separated by a day or more but within a week. The histogram below shows the number of discoveries in one year of operation, using these assumptions. | ||||||||
| Line: 21 to 16 | ||||||||
| The Ia sample will be complete out to z~0.1 (based on iPTF, Papadogiannakis et al., in prep.). | ||||||||
| Changed: | ||||||||
| < < | Candidate typing | |||||||
| > > | I-band requirementsThe SN Ia i-band requirements originate from: 1) lightcurves in at least three filters are necessary for SN Ia distances; 2) SN Ia physics science based on measuring the characteristics of the second peak (time and peak flux) visible at filters redder than the R-band; 3) Detection of the second peak is a unique feature of SNe Ia, and can be used to photometrically type the full sample after the survey complete, which is necessary for detailed and unbiased SN rates studies above the spectroscopic threshold of z=0.1.SN Ia cosmologyThe primary goal of the ZTF SN Ia survey is to provide a low-z legacy sample for future cosmology analyses. To reach this goal, we require lightcurves of 2000 SNe Ia in at least three bands, as described in the white paper, where the lightcurve of each SN in the sample needs to be measured with a statistical precision that is at the level or better than the intrinsic uncertainty of SNe Ia. For ZTF the limitiation will be the effective cadence of the I-band survey. To estimate the properties of the I-band peak we need at least four data points within -10 < p < +15 days with respect to time of maximum, with at least one point before and one point after maximum. Based on simulation we conclude that this criteria will be reached for xx-XX, yy-YY, zz-ZZ of the discovered SN Ia sample at z<0.1 for a 4,5,6 and 9 day cadence respectively. The range corresponds to the expected uncertainty due to the weather conditions. The simulations have been carried out assuming weather conditions for 2013 and 2016. The full histogram is shown below.
SN Ia physics with the I-bandThe time and characteristic of the second peak is both correlated with the Ni mass of the SN Ia, and provides a promising path for improving standardization of SNe Ia for cosmology. In order to obtain an unbiased measurement of the second peak, it is not enough to sample only the peak itself but also to capture the minimum between the two peaks. In order to do this we require at least 6 datapoints between 10 < p < 50 which will be reached for xx-XX, yy-YY, zz-ZZ of the discovered SN Ia sample at z<0.1 for a 4,5,6 and 9 day cadence respectively.
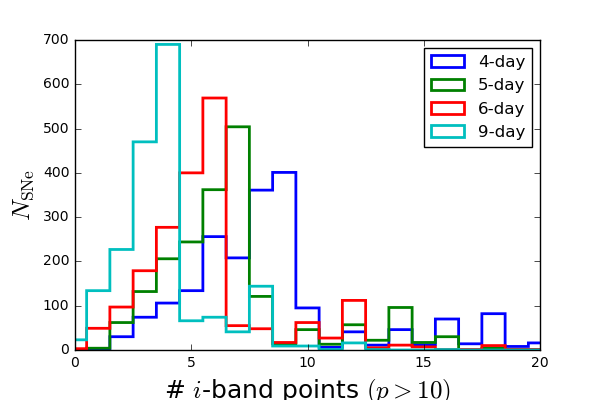
Post-survey typing using the I-bandThe presence of the second peak can be used for photometrically typing using the full lightcurves of all SNe, since this a feature unique to SNe Ia. This will allow us to measure SN Ia rates, both in an absolute sense and environment dependencies, for the full sample, i.e. we are not limited to the spectroscopically confirmed sample at z < 0.1. The requirement for securing the existence of a second peak are less strict than above, and 4 data points are enough between 10 < p < 50 days which will be reached for xx-XX, yy-YY, zz-ZZ of the discovered SN Ia sample at z<0.1 for a 4,5,6 and 9 day cadence respectively.Live candidate typing | |||||||
Candidate selection will be carried out based on photometric typing based on the presumed host galaxy photometric redshift and the lightcurve during the rise. We are currently development an algorithm for this. Using the same simulations as above we can constrain the contamination in the current implementation of our 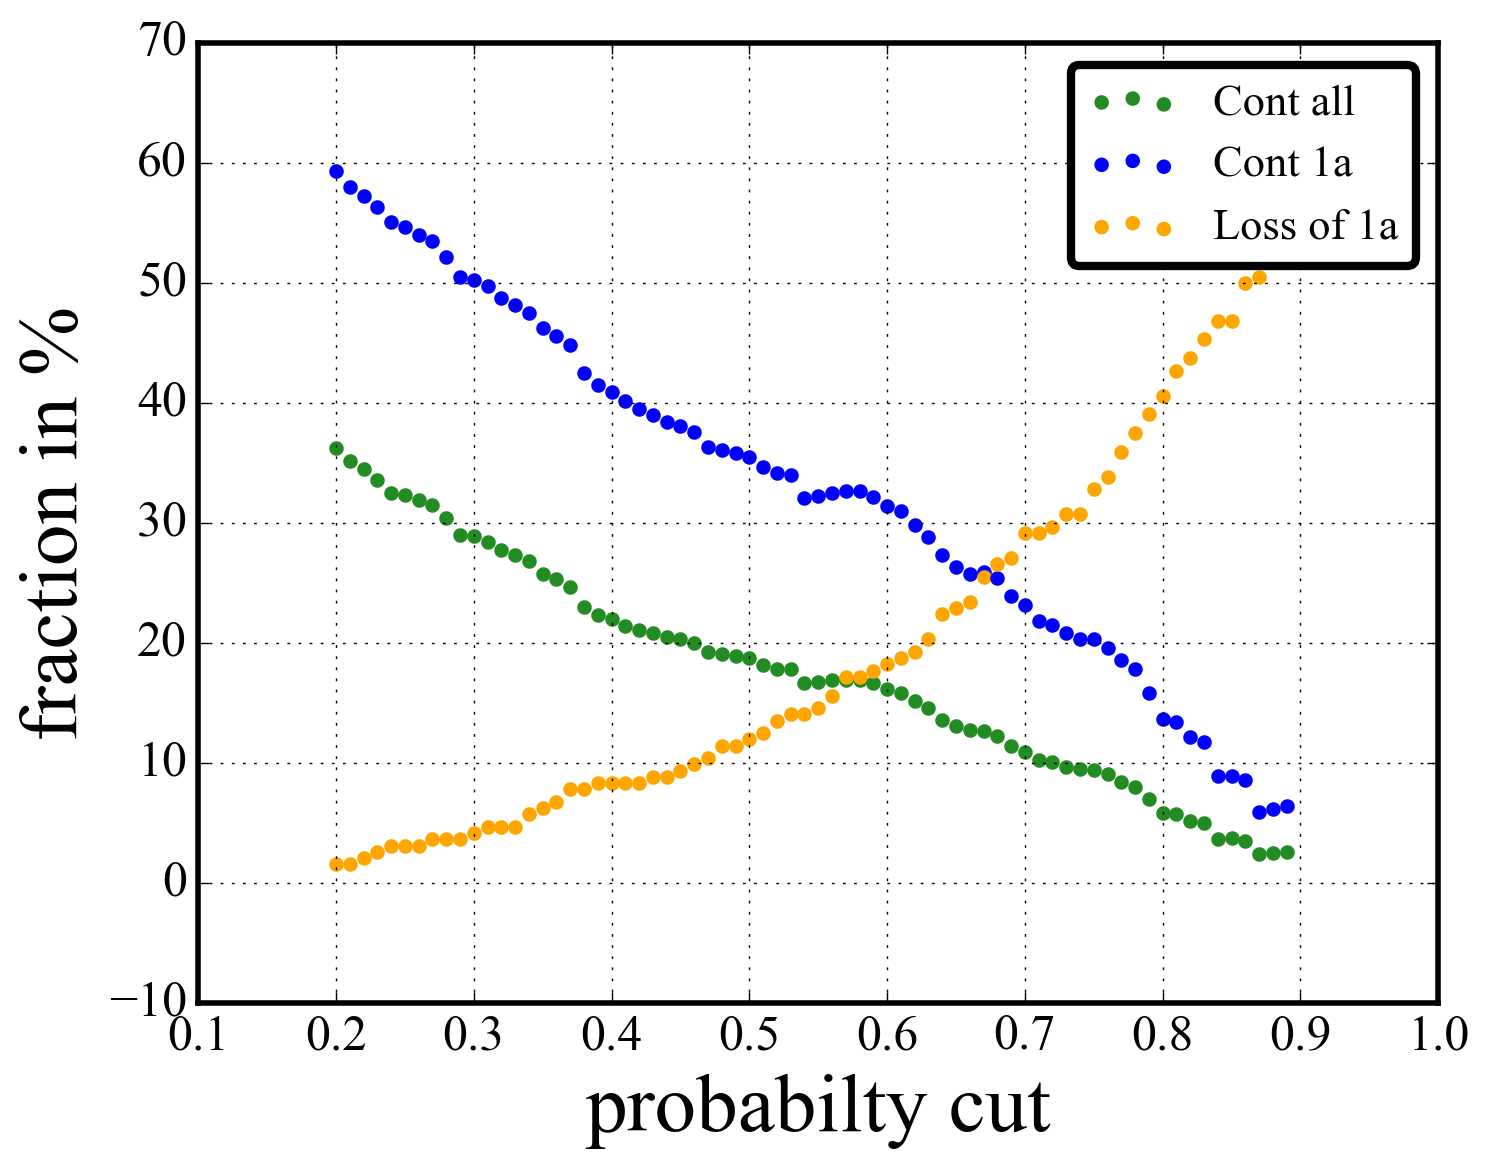 | ||||||||
| Deleted: | ||||||||
| < < | Using full lightcurves we can classify the SNe Ia (which will dominate the sample as shown above) by using the second peak in i-band which is a characteristic feature of SNe Ia. With a 4-day cadence we should have at least 4 points covering the second i-band peak for 90% of the sample. 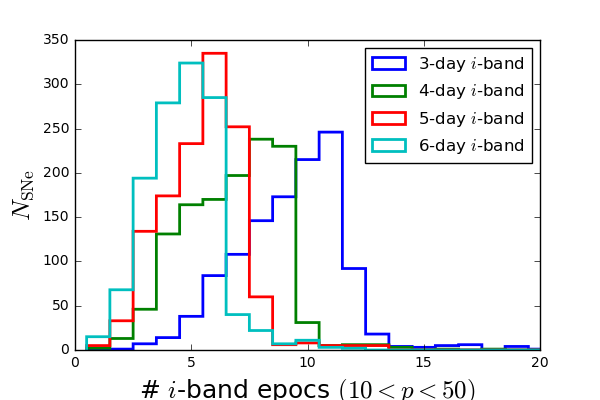 | |||||||
Cosmological predictionsBinned uncertainties of mu for JLA, WFIRST and ZTF (assuming 1800 SNe at z < 0.1 with redshift distribution as above). Systematic errors have been included for both the high-z (WFIRST) and ZTF samples. | ||||||||
Revision 112017-02-16 - UlrichFeindt
| Line: 1 to 1 | |||||||||
|---|---|---|---|---|---|---|---|---|---|
Simulation of SNe Observation for Survey Strategy Observations | |||||||||
| Line: 56 to 56 | |||||||||
| |||||||||
| Added: | |||||||||
| > > |
| ||||||||
Revision 102017-02-16 - RahmanAmanullah
| Line: 1 to 1 | ||||||||
|---|---|---|---|---|---|---|---|---|
Simulation of SNe Observation for Survey Strategy Observations | ||||||||
| Added: | ||||||||
| > > | I-band requirementsThe SN Ia i-band requirements originate from: 1) lightcurves in at least three filters are necessary for SN Ia distances; 2) SN Ia physics science based on measuring the characteristics of the second peak (time and peak flux) visible at filters redder than the R-band; 3) Detection of the second peak is a unique feature of SNe Ia, and can be used to photometrically type the full sample after the survey complete, which is necessary for detailed and unbiased SN rates studies above the spectroscopic threshold of z=0.1.Target statistical uncertaintyThe primary goal of the ZTF SN Ia survey is to provide a low-z legacy sample for future cosmology analyses. To reach this goal, each SN in the sample needs to be measured with a statistical precision that is at the level or better than the intrinsic uncertainty of SNe Ia. For the full population of normal SNe Ia the r-i color uncertainty is close 0.08 mag (e.g. Burns et al, 2014). In order to decrease the uncertainty on individual SN Ia distances beyond today's level, by subdividing dividing the sample, the individual colors will have to be measured with higher precision. It has been shown that when SNe Ia are subdivided based on spectroscopic similarities V-I uncertainties down to 0.03 magnitudes can be obtained. | |||||||
Discovery ratesWe have based all our discovery rates using the assumption that 15000 square degrees will be covered over a 3-day period in the g and r bands (the MSIP survey), using a fixed schedule. A discovery is defined as two points detected on the rise with S/N > 5, separated by a day or more but within a week. The histogram below shows the number of discoveries in one year of operation, using these assumptions. | ||||||||
Revision 92017-01-27 - RahmanAmanullah
| Line: 1 to 1 | |||||||||||||
|---|---|---|---|---|---|---|---|---|---|---|---|---|---|
Simulation of SNe Observation for Survey Strategy Observations | |||||||||||||
| Line: 16 to 16 | |||||||||||||
The Ia sample will be complete out to z~0.1 (based on iPTF, Papadogiannakis et al., in prep.).
Candidate typing | |||||||||||||
| Added: | |||||||||||||
| > > | Candidate selection will be carried out based on photometric typing based on the presumed host galaxy photometric redshift and the lightcurve during the rise. We are currently development an algorithm for this. Using the same simulations as above we can constrain the contamination in the current implementation of our
Using full lightcurves we can classify the SNe Ia (which will dominate the sample as shown above) by using the second peak in i-band which is a characteristic feature of SNe Ia. With a 4-day cadence we should have at least 4 points covering the second i-band peak for 90% of the sample. | ||||||||||||
Cosmological predictionsBinned uncertainties of mu for JLA, WFIRST and ZTF (assuming 1800 SNe at z < 0.1 with redshift distribution as above). Systematic errors have been included for both the high-z (WFIRST) and ZTF samples. | |||||||||||||
| Line: 36 to 41 | |||||||||||||
| -- MickaelRigault - 22 Oct 2015 -- RahmanAmanullah - 26 Jan 2017 | |||||||||||||
| Deleted: | |||||||||||||
| < < |
| ||||||||||||
| |||||||||||||
| Changed: | |||||||||||||
| < < |
| ||||||||||||
| > > |
| ||||||||||||
| |||||||||||||
| Added: | |||||||||||||
| > > |
| ||||||||||||
Revision 82017-01-27 - RahmanAmanullah
| Line: 1 to 1 | ||||||||
|---|---|---|---|---|---|---|---|---|
Simulation of SNe Observation for Survey Strategy ObservationsDiscovery rates | ||||||||
| Changed: | ||||||||
| < < | We have based all our discovery rates using the assumption that 15000 square degrees will be covered over any 3-day period in the g and r bands. We are assuming a fixed schedule, independent of weather conditions. The histogram below shows the number of discoveries in one year of operation. | |||||||
| > > | We have based all our discovery rates using the assumption that 15000 square degrees will be covered over a 3-day period in the g and r bands (the MSIP survey), using a fixed schedule. A discovery is defined as two points detected on the rise with S/N > 5, separated by a day or more but within a week. The histogram below shows the number of discoveries in one year of operation, using these assumptions. | |||||||
 | ||||||||
| Changed: | ||||||||
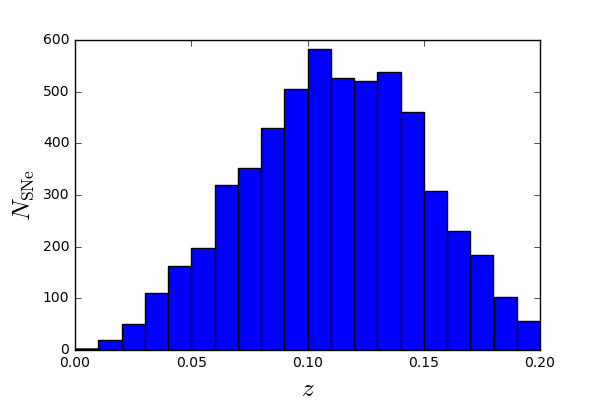
| < < | The histogram below shows the number of SNe Ia that pass the cut of being visible between -10 and +40 days in rest frame (both g and r above 5 sigma in the same night). This requirements comes from determining the light curve shape of each individual SNe Ia, and measure the color, and to capture the beginning of the Lira law (>+35 days) where color evolution is well understood and has the lowest dispersion. Many of these SNe Ia will of course be visible at even later times. | |||||||
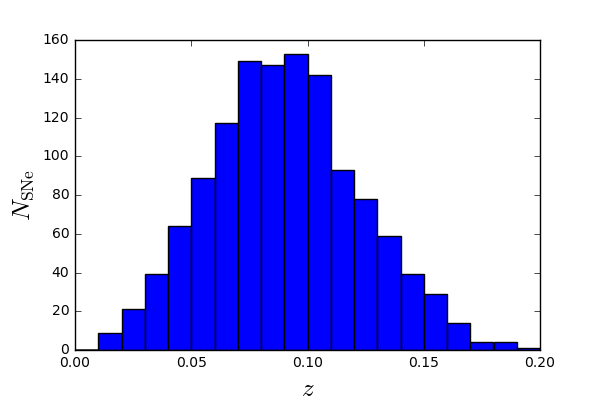
| > > | The histogram below shows the number of SNe Ia from the figure above that will be discovered prior to day -10 and visible beyond day +40 in rest frame. This is the requirement for our core sample, and allows accurate measurement of the lightcurve peak, shape, color, and to capture the beginning of the Lira law (>+35 days) where color evolution is well understood and has the lowest dispersion. Many of these SNe Ia will of course be visible at even later times. | |||||||
 | ||||||||
Revision 72017-01-26 - UlrichFeindt
| Line: 1 to 1 | ||||||||
|---|---|---|---|---|---|---|---|---|
Simulation of SNe Observation for Survey Strategy Observations | ||||||||
| Line: 7 to 7 | ||||||||
Discovery ratesWe have based all our discovery rates using the assumption that 15000 square degrees will be covered over any 3-day period in the g and r bands. We are assuming a fixed schedule, independent of weather conditions. The histogram below shows the number of discoveries in one year of operation. | ||||||||
| Changed: | ||||||||
| < < |  | |||||||
| > > | | |||||||
| The histogram below shows the number of SNe Ia that pass the cut of being visible between -10 and +40 days in rest frame (both g and r above 5 sigma in the same night). This requirements comes from determining the light curve shape of each individual SNe Ia, and measure the color, and to capture the beginning of the Lira law (>+35 days) where color evolution is well understood and has the lowest dispersion. Many of these SNe Ia will of course be visible at even later times. | ||||||||
| Line: 46 to 46 | ||||||||
| ||||||||
| Added: | ||||||||
| > > |
| |||||||
Revision 62017-01-26 - UlrichFeindt
| Line: 1 to 1 | ||||||||
|---|---|---|---|---|---|---|---|---|
Simulation of SNe Observation for Survey Strategy Observations | ||||||||
| Line: 7 to 7 | ||||||||
Discovery ratesWe have based all our discovery rates using the assumption that 15000 square degrees will be covered over any 3-day period in the g and r bands. We are assuming a fixed schedule, independent of weather conditions. The histogram below shows the number of discoveries in one year of operation. | ||||||||
| Added: | ||||||||
| > > | | |||||||
| The histogram below shows the number of SNe Ia that pass the cut of being visible between -10 and +40 days in rest frame (both g and r above 5 sigma in the same night). This requirements comes from determining the light curve shape of each individual SNe Ia, and measure the color, and to capture the beginning of the Lira law (>+35 days) where color evolution is well understood and has the lowest dispersion. Many of these SNe Ia will of course be visible at even later times. | ||||||||
| Added: | ||||||||
| > > | | |||||||
The Ia sample will be complete out to z~0.1 (based on iPTF, Papadogiannakis et al., in prep.).
Candidate typing | ||||||||
Revision 52017-01-26 - RahmanAmanullah
| Line: 1 to 1 | |||||||||||||
|---|---|---|---|---|---|---|---|---|---|---|---|---|---|
Simulation of SNe Observation for Survey Strategy Observations | |||||||||||||
| Line: 32 to 32 | |||||||||||||
| -- MickaelRigault - 22 Oct 2015 -- RahmanAmanullah - 26 Jan 2017 | |||||||||||||
| Added: | |||||||||||||
| > > |
| ||||||||||||
| |||||||||||||
| Added: | |||||||||||||
| > > |
| ||||||||||||
Revision 42017-01-26 - UlrichFeindt
| Line: 1 to 1 | ||||||||
|---|---|---|---|---|---|---|---|---|
Simulation of SNe Observation for Survey Strategy Observations | ||||||||
| Line: 36 to 36 | ||||||||
| ||||||||
| Added: | ||||||||
| > > |
| |||||||
Revision 32017-01-26 - RahmanAmanullah
| Line: 1 to 1 | |||||||||
|---|---|---|---|---|---|---|---|---|---|
Simulation of SNe Observation for Survey Strategy Observations | |||||||||
| Line: 7 to 7 | |||||||||
Discovery ratesWe have based all our discovery rates using the assumption that 15000 square degrees will be covered over any 3-day period in the g and r bands. We are assuming a fixed schedule, independent of weather conditions. The histogram below shows the number of discoveries in one year of operation. | |||||||||
| Changed: | |||||||||
| < < | The histogram below shows the number of SNe Ia that pass the cut of being visible between -10 and +40 days in rest frame. This requirements comes from determining the light curve shape of each individual SNe Ia, and measure the color, and to capture the beginning of the Lira law (>+35 days) where color evolution is well understood and has the lowest dispersion. Many of these SNe Ia will of course be visible at even later times. | ||||||||
| > > | The histogram below shows the number of SNe Ia that pass the cut of being visible between -10 and +40 days in rest frame (both g and r above 5 sigma in the same night). This requirements comes from determining the light curve shape of each individual SNe Ia, and measure the color, and to capture the beginning of the Lira law (>+35 days) where color evolution is well understood and has the lowest dispersion. Many of these SNe Ia will of course be visible at even later times. | ||||||||
| Changed: | |||||||||
| < < | The Ia sample will be complete out to z~0.1 (based on iPTF, Papadogiannakis et al., in prep.). | ||||||||
| > > | The Ia sample will be complete out to z~0.1 (based on iPTF, Papadogiannakis et al., in prep.). | ||||||||
Candidate typingCosmological predictions | |||||||||
| Added: | |||||||||
| > > | Binned uncertainties of mu for JLA, WFIRST and ZTF (assuming 1800 SNe at z < 0.1 with redshift distribution as above). Systematic errors have been included for both the high-z (WFIRST) and ZTF samples. 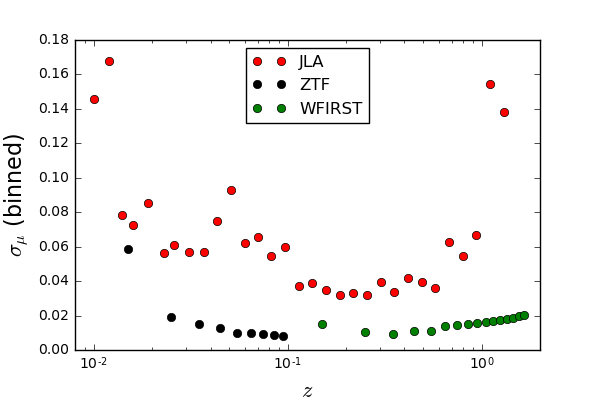 | ||||||||
| Added: | |||||||||
| > > | The DE EOS constraints for different sample sizes in the absence of any systematic errors, and astrophysical effects (e.g. that there is only one single extinction law in the Universe) 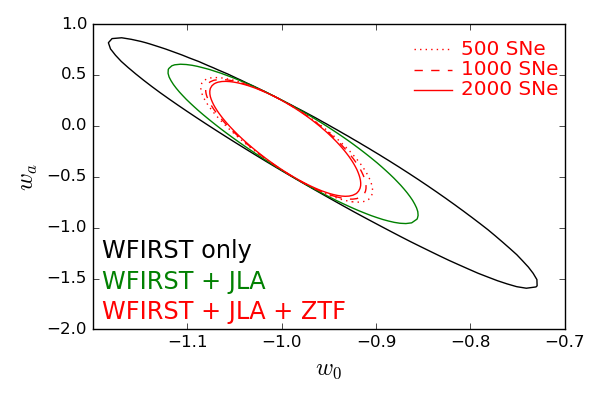 The impact from different extinction laws on the average Rv for the sample and how the uncertainty propagates to the distance modulus. This is assuming that each SN is observed in filters gri and that the color uncertainty is dominated by the current understanding of intrinsic color uncertainties (CSP, Burns et al., 2014). In other words this is a pessimistic scenario, assuming that we will not learn anything new about SNe Ia. For each SN Ia, the color is drawn from an exponential distribution with lambda=0.11, and the Rv is drawn from a uniform distribution in the range _Rv_=2-3.
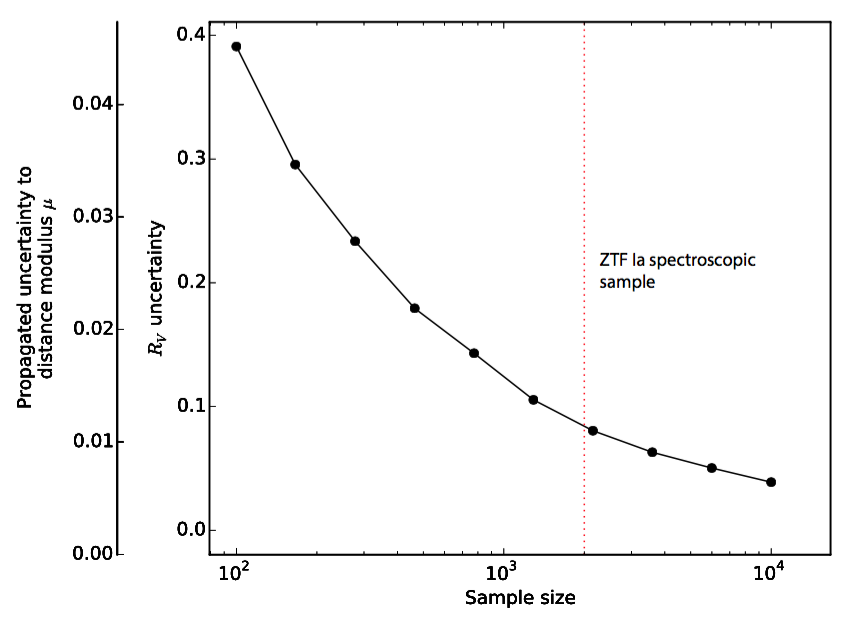 Simulated 68% confidence contours for the (w_0,w_a)-plane. The data were generated assuming a cosmological constant, which corresponds to (w_0,w_a)=(-1,0).
The black contours show the expected WFIRST constraints (dotted), when this data are combined with the current JLA sample (dashed), and the ZTF data (black). The color contours illustrate the impact of a systematic magnitude offset between the ZTF sample and the other data sets of 1% (blue), 2% (red) and 3% (green), respectively.
Simulated 68% confidence contours for the (w_0,w_a)-plane. The data were generated assuming a cosmological constant, which corresponds to (w_0,w_a)=(-1,0).
The black contours show the expected WFIRST constraints (dotted), when this data are combined with the current JLA sample (dashed), and the ZTF data (black). The color contours illustrate the impact of a systematic magnitude offset between the ZTF sample and the other data sets of 1% (blue), 2% (red) and 3% (green), respectively. 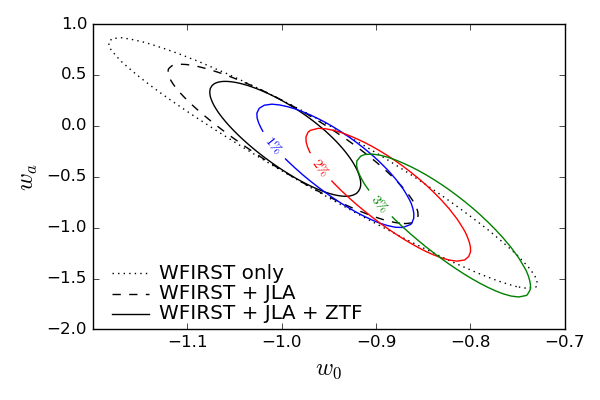 | ||||||||
| -- MickaelRigault - 22 Oct 2015 \ No newline at end of file | |||||||||
| Added: | |||||||||
| > > | -- RahmanAmanullah - 26 Jan 2017
| ||||||||
Revision 22017-01-26 - RahmanAmanullah
| Line: 1 to 1 | ||||||||
|---|---|---|---|---|---|---|---|---|
Simulation of SNe Observation for Survey Strategy Observations | ||||||||
| Added: | ||||||||
| > > | ||||||||
| Added: | ||||||||
| > > | Discovery ratesWe have based all our discovery rates using the assumption that 15000 square degrees will be covered over any 3-day period in the g and r bands. We are assuming a fixed schedule, independent of weather conditions. The histogram below shows the number of discoveries in one year of operation. The histogram below shows the number of SNe Ia that pass the cut of being visible between -10 and +40 days in rest frame. This requirements comes from determining the light curve shape of each individual SNe Ia, and measure the color, and to capture the beginning of the Lira law (>+35 days) where color evolution is well understood and has the lowest dispersion. Many of these SNe Ia will of course be visible at even later times. The Ia sample will be complete out to z~0.1 (based on iPTF, Papadogiannakis et al., in prep.).Candidate typingCosmological predictions | |||||||
| -- MickaelRigault - 22 Oct 2015 \ No newline at end of file | ||||||||
Revision 12015-10-22 - MickaelRigault
| Line: 1 to 1 | ||||||||
|---|---|---|---|---|---|---|---|---|
| Added: | ||||||||
| > > |
Simulation of SNe Observation for Survey Strategy Observations-- MickaelRigault - 22 Oct 2015 | |||||||
View topic | History: r14 < r13 < r12 < r11 | More topic actions...
Ideas, requests, problems regarding TWiki? Send feedback