| |
| META TOPICPARENT |
name="CosmologyWorkingGroup" |
Lightcurve Simulations |
| | Lightcurve simulations for SNe (Ia and CC) using simsurvey
Status/Results |
|
<
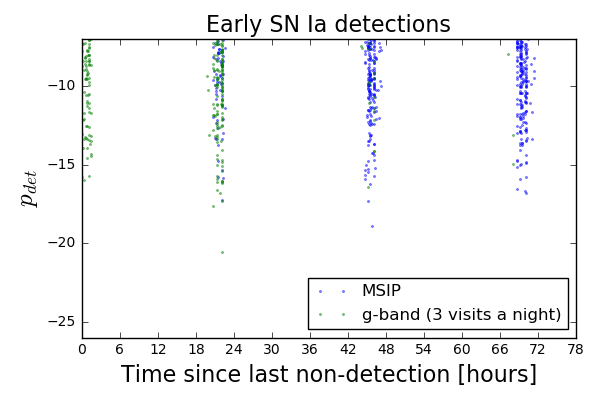
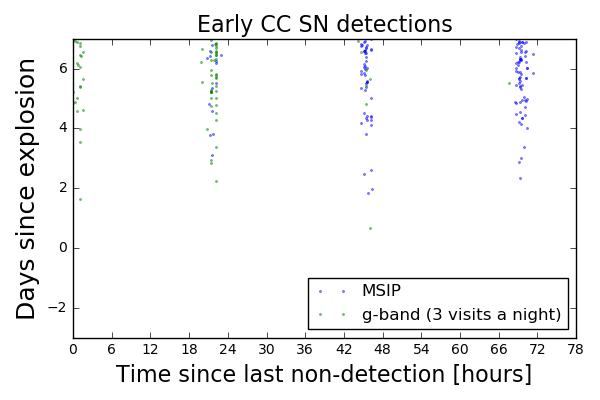
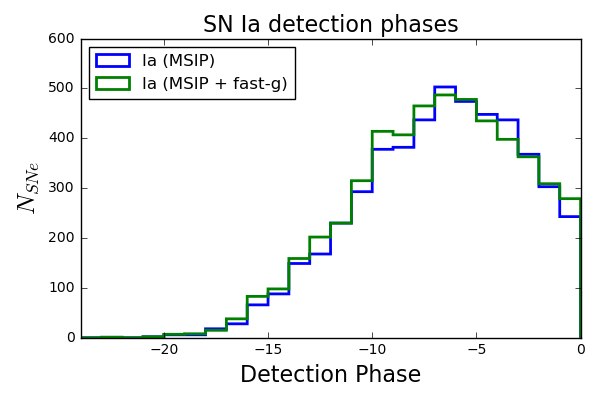
< | Most current simulation is for the SEDm white papers. It assumes 6 months of MSIP gR survey but I have also simulated a fast g-band survey starting in mid-February. |
>
> |
Simulation parameters
The most current simulation is for the SEDm white papers. It assumes 6 months of MSIP gR survey but I have also simulated a fast g-band survey starting in mid-February. |
| |
- Two simulations of SN Ia lightcurves were run: one based on 1000 SED realizations from P.-F. Leget's SUGAR template and another based on the Hsiao template. The assumed rate is 3 x 10^-5 yr^-1 Mpc^-3.
- CC SN lightcurves are based on the Nugent templates in sncosmo, assuming the absolute magnitude distributions from Richardson et al. (In case of the IIn's the distribution is truncated at 1 sigma on the bright side to avoid very bright lightcurves.) For the total CC SN rate 1.5 x 10^-4 yr^-1 Mpc^-3 is used and split into 80% IIP, 15% Ib/c, and 5% IIn.
- SNe are simulated up to z = 0.2 with the exception of IIP's, which are only simulated up to z = 0.15 (due to high rate and low luminosity).
- The survey plan is based on Peter's code that calculates which fields are observable in a given night. Afterwards the iPTF observation history of 2016 was used to throw out nights in a realistic way, including a two-week gap.
|
|
<
< | [Add more on results] |
>
> | Results
Rate of new discoveries
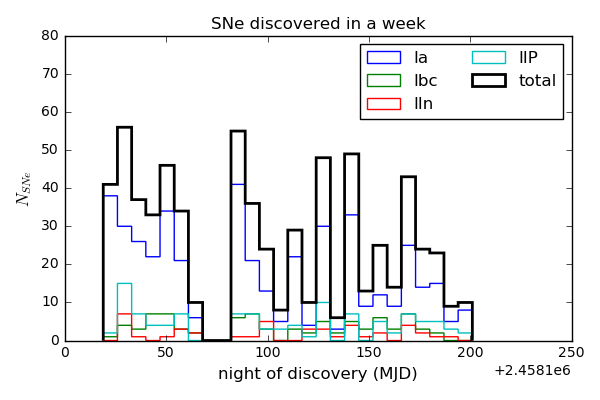
The simulated SNe can be grouped by discovery date to determine the number of new SNe per week:
| |
g_max<18.5 |
g_max<19 |
g_max<19.5 |
| |
median |
max |
median |
max |
median |
max |
| Ia |
14.5 |
41 |
31 |
77 |
66 |
137 |
| Ib/c |
3 |
7 |
5 |
12 |
9 |
26 |
| IIn |
1 |
7 |
3 |
8 |
6.5 |
14 |
| IIP |
24.5 |
56 |
8.5 |
27 |
15.5 |
36 |

Time of discovery


 |
| |
References |

